[ad_1]
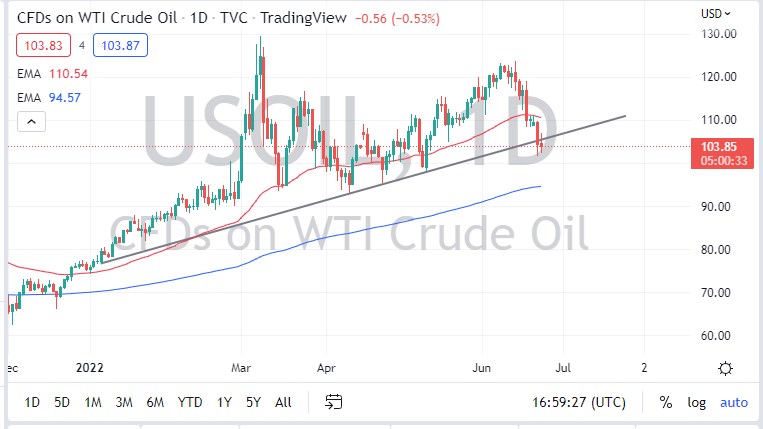
The 200 Day EMA is at the $95 level, and that could be the target on a breakdown.
The West Texas Intermediate Crude Oil market has been very noisy on Thursday as we await inventory figures. At this point, we are most certainly pressuring the downside and the major trend line that I have marked on the chart. This is because there are so many different moving pieces right now that the oil market does not know exactly what to do.
One of the biggest struggles in this market is the fact that the economy appears to be slowing down. Ultimately, the market is likely to react to this because demand should drop. However, there are a lot of questions as to the supply, but the rate of change right now in the United States is somewhat concerning as far as gasoline demand is concerned. Having said that, longer-term we are still in an uptrend and it’s not until we break down below the $100 level that I think the actual trend itself is broken. The market is in an area that could provide a nice bounce, especially as we stabilized on Thursday after selling off again.
If we were to turn around, if we can break above the $110 level, it’s likely that we can continue to go higher, because we would also break the 50 Day EMA, and therefore go much higher. At that point, it’s likely that we go to find the $120 level. The $120 level has been a significant amount of resistance previously, and therefore it is a bit of a magnet for those who are trying to send this market much higher. After all, we have seen a lack of drilling and production during the pandemic, and as a result, there is a lot of catching up to do. Furthermore, the situation with Russian production continues to be an issue, as it is not spread out all over the world like it normally would be.
Ultimately, I use the $100 level as a bit of a proxy for an uptrend or downturn, and right now we’re still very much in an uptrend. Because of this, I like the idea of buying momentum to the upside, but if we break down below the $100 level, then I will have to flip the script and start shorting on signs of exhaustion. The 200 Day EMA is at the $95 level, and that could be the target on a breakdown.

[ad_2]

