[ad_1]
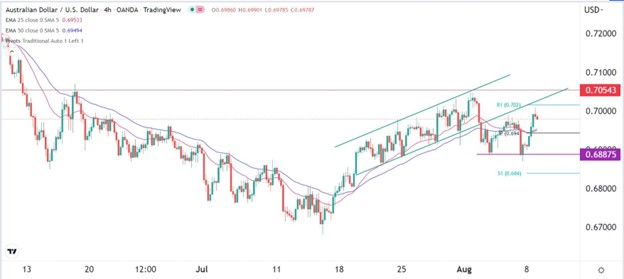
The pair will likely continue rising as bulls target the next key resistance point at 0.7055.
Bullish View
- Buy the AUD/USD pair and set a take-profit at 0.7055.
- Add a stop-loss at 0.6940.
- Timeline: 1 day.
Bearish View
- Set a sell-stop at 0.6950 and a take-profit at 0.6875.
- Add a stop-loss at 0.7060.
The AUD/USD price recovered as the US dollar retreated. The pair rose to a high of 0.7000, which was the highest point since August 2nd. It has also rebounded by more than 1.85% from the lowest level on Friday after the US published strong jobs data.
US Consumer Inflation Data Ahead
The AUD/USD pair rose slightly as the US dollar retreated. The dollar index retreated by about 0.40% in the overnight session as investors continued focusing on last Friday’s jobs data. According to the Bureau of Labor Statistics (BLS), the economy added over 528k jobs in July while the unemployment rate dropped to 3.6%.
Wages also continued rising. As a result, investors now believe that the Federal Reserve will continue hiking interest rates in the coming months. In an interview on Sunday, Mary Daly said that she supported a 0.50% rate hike in September.
In a separate report, Michelle Bowman, a Fed governor said that she strongly supported last month’s 0.75% rate hike. She added that she also supported similar rate hikes until inflation started declining in a consistent and lasting way.
There will be no major economic data from Australia. Therefore, the next key data to watch will be the upcoming inflation data from the US. Economists expect the data to show that inflation dropped from 1.3% to 0.2% on a month-on-month basis. They also expect that prices dropped from 9.1% to 8.7% on a year-on-year basis.
Further, economists expect the data to show that core CPI fell from 0.7% to 0.5%. On a YoY basis, they expect that core CPI rose from 5.9% to 6.1%. These numbers are still substantially higher than the Fed target of 2.0%.
AUD/USD Forecast
The four-hour chart shows that the AUD/USD pair has formed a double-bottom pattern at 0.6887. In price action analysis, this pattern is usually a bullish sign. It has now moved slightly above the 25-day and 50-day moving averages.
The pair has moved slightly below the first resistance of the standard pivot point while the Relative Strength Index (RSI) has pointed upwards. Therefore, the pair will likely continue rising as bulls target the next key resistance point at 0.7055. This price was the highest point since August 1st.

Ready to trade our daily Forex signals? Here’s a list of some of the best Forex trading platforms to check out.
[ad_2]

